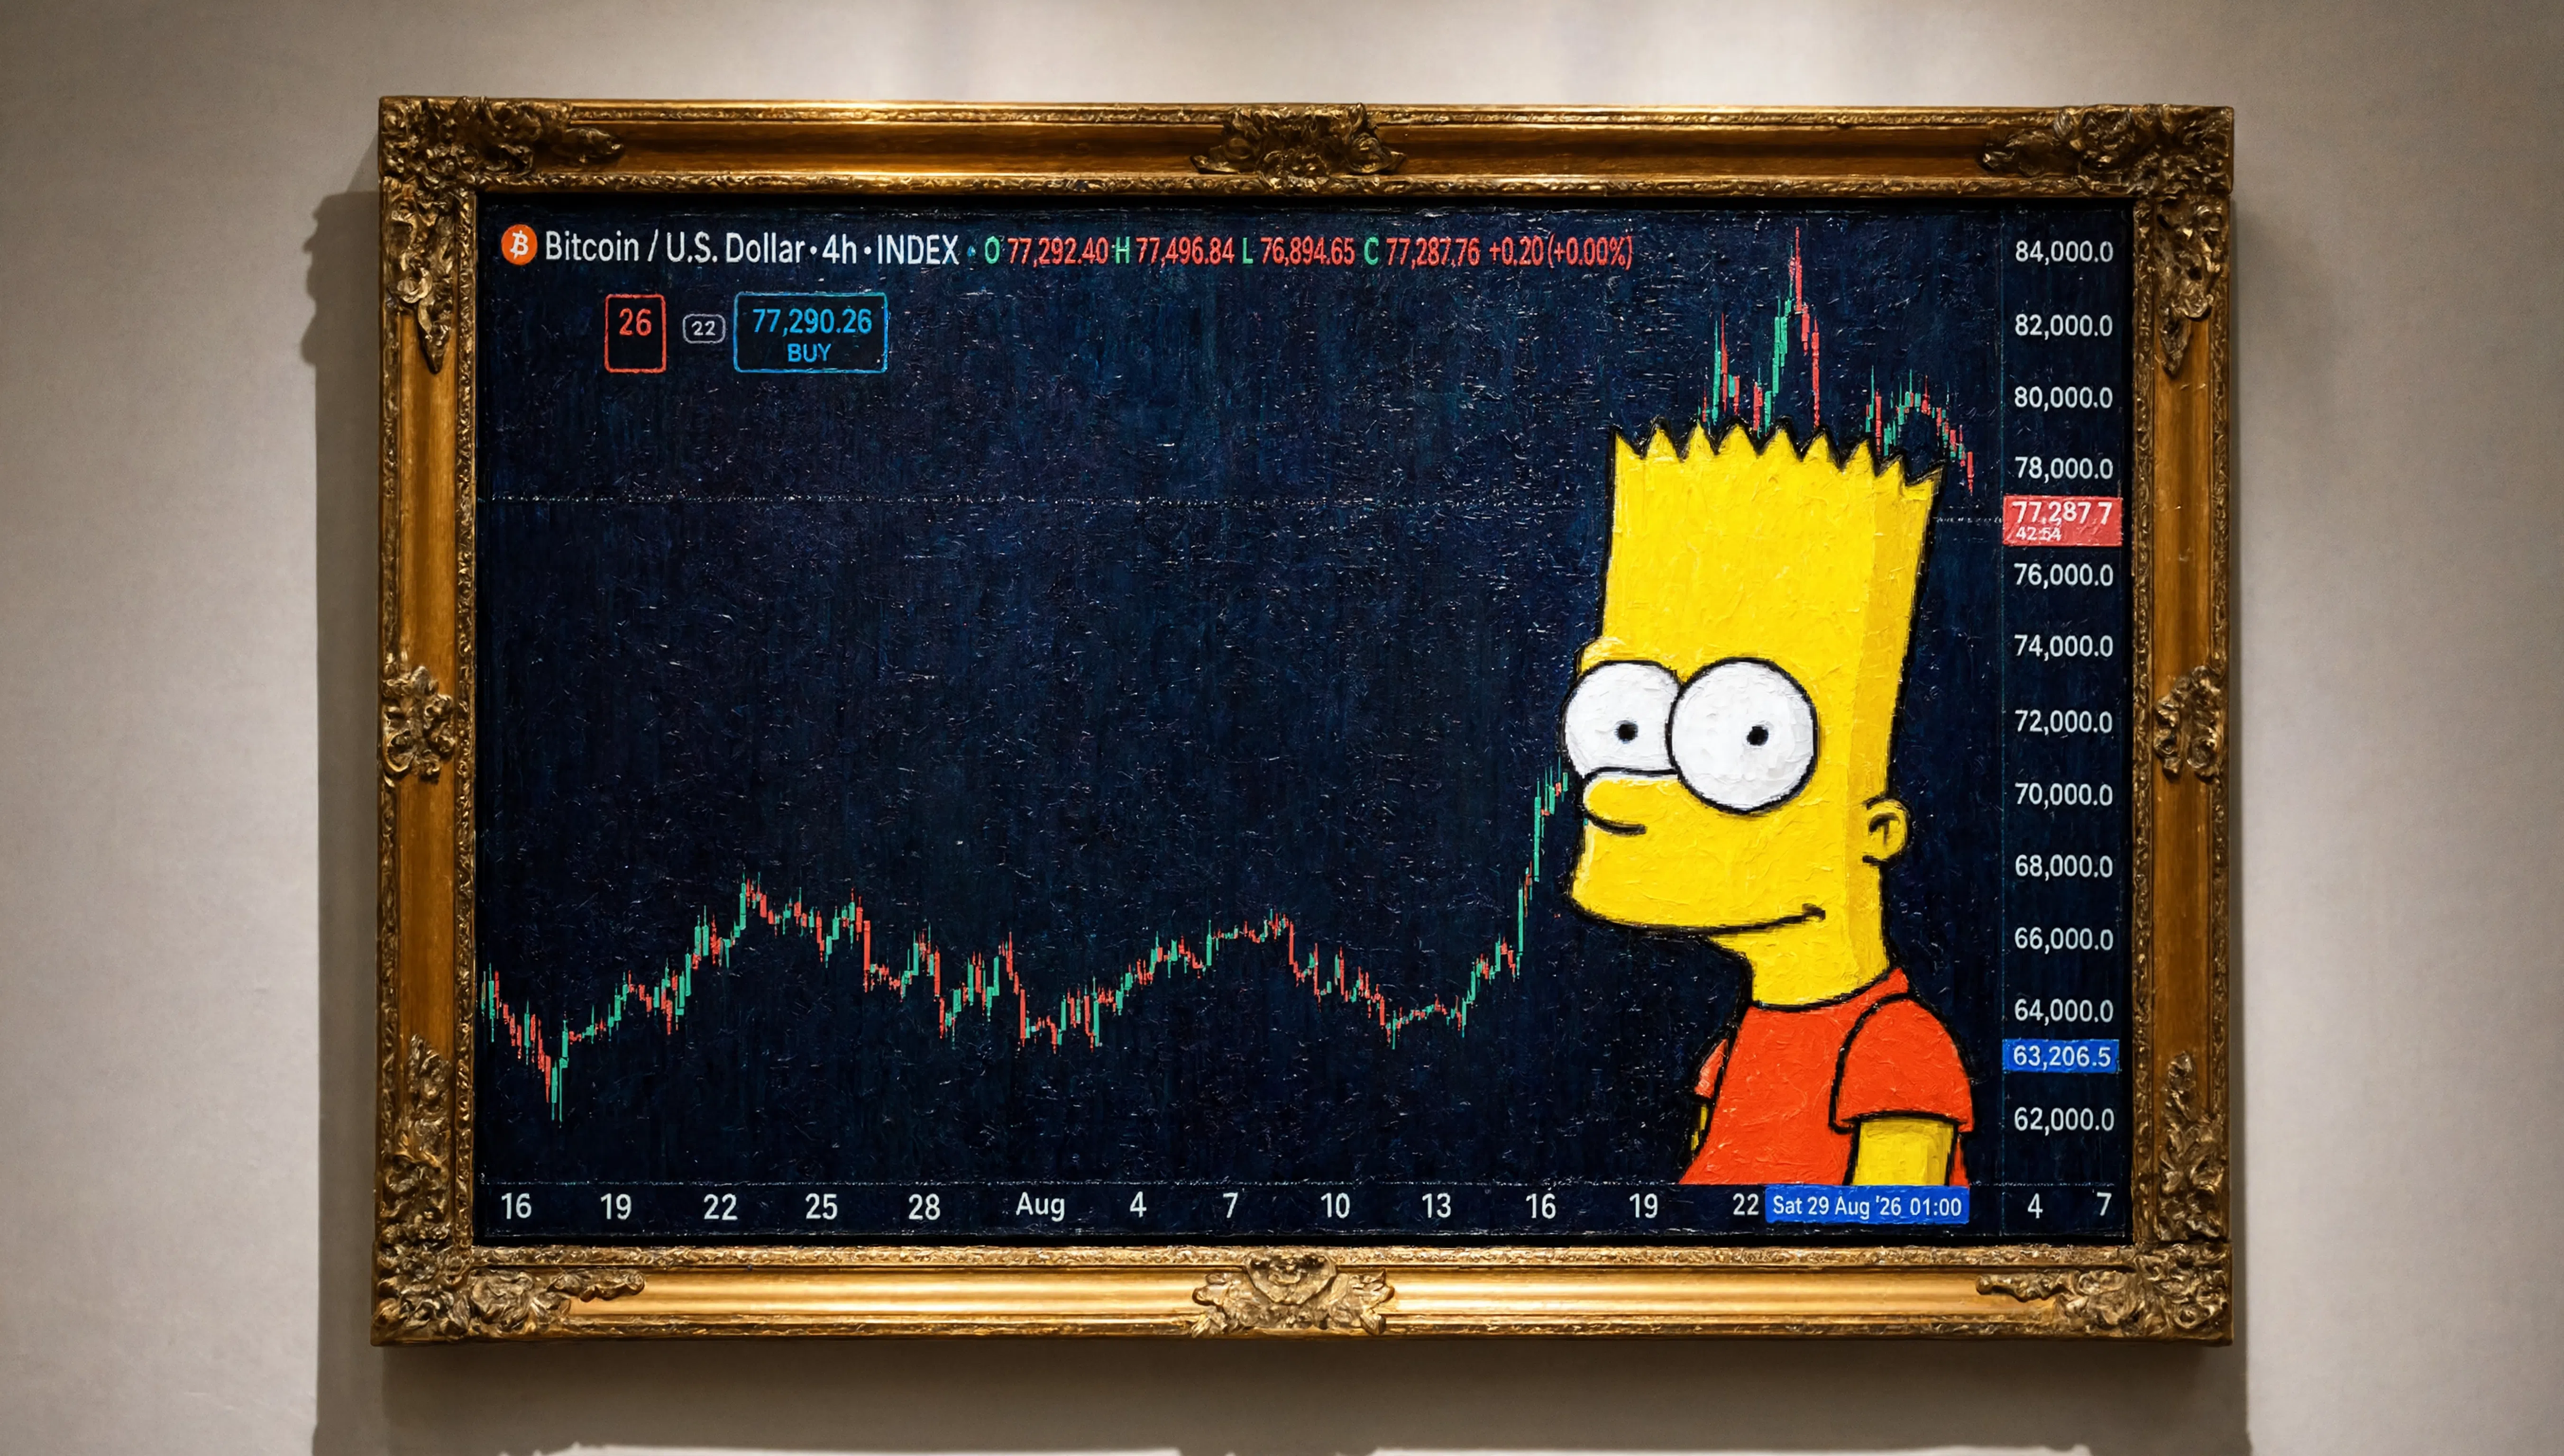
Bitcoin technicals: The price of bitcoin is back below the 100/200 hour MA and making new corrective lows

Bitcoin buyers had a strong run higher, but they are now losing some steam. To restart the bullish engine, they need to reclaim two key short-term technical levels—and stay above them.The rally gained momentum on August 19, when Bitcoin moved above both its 100-day moving average near $66,200 and its 200-day moving average near $69,000 in a single day. A moving average smooths out price fluctuations to help traders judge the trend. Breaking above both was an important bullish development, and buyers followed through, pushing Bitcoin to $81,455 on August 28—its highest level since May.Since that peak, however, the price has been moving up and down without extending the rally. It has also crossed below and back above its 100-hour and 200-hour moving averages, suggesting a less decisive battle between buyers and sellers.Currently, those levels are:100-hour moving average: $78,025200-hour moving average: $78,436With Bitcoin trading near $77,148 after reaching a low of $76,229 today, the price is below both. That gives sellers the short-term technical advantage.For a beginner trader, these moving averages provide a useful dividing line. Stay below them, and the short-term bias remains bearish. Move above both and hold above them, and the outlook becomes more bullish. A brief move above followed by a quick reversal would be less convincing.The daily chart also gives buyers something to prove.Bitcoin’s larger decline took the price from its all-time high of $126,272 to a late-June low of $57,735. The rebound since then has recovered some of that decline, but it has not reached the 38.2% Fibonacci retracement near $83,916.What does that mean? A retracement measures how much of a previous move the price has recovered. In this case, reaching $83,916 would recover roughly 38.2% of the decline. I often look at that level as an initial hurdle buyers need to clear to make a stronger case that a rebound is developing into a more meaningful reversal.So far, they have fallen short.The August 28 high of $81,455 also stalled inside a previous swing area between $80,560 and $82,833, dating back to November 2025. A swing area is a zone where the price has previously turned or repeatedly found support or resistance. Traders watch those zones because they can become obstacles again.The failure to clear that area—and then reach the 38.2% retracement—leaves open the possibility that the rally is still a recovery within the broader downtrend. The bounce has been substantial, but buyers have more work to do to demonstrate lasting control.Could the latest pullback simply be a pause before another move higher? Absolutely. But the technical levels give traders a way to judge that possibility as the price action develops.The first test is the $78,025–$78,436 moving-average zone. Getting above both levels and staying above them would shift the short-term advantage back toward buyers. Beyond that, attention would turn to the $80,560–$82,833 resistance area, including the recent $81,455 high, and then the $83,916 retracement.Until those first hurdles are cleared, I give sellers the short-term edge.The lesson for newer traders is that you do not have to predict every move. Identify the levels that define the bias, watch how the price responds, and recognize when that response changes the outlook. Those levels help define risk; they do not guarantee the next move.In the video above, I walk through these technical levels and explain what buyers need to do to restart Bitcoin’s bullish engine. Watch it and learn. This article was written by Greg Michalowski at investinglive.com.
This is a summary aggregated from ForexLive. Read the complete article on the original site:
Read full article at ForexLive